While it’s difficult to be the best investor in the world, we can all actively avoid being a ‘bad investor’ by learning from history and staying the course.
Extended periods of market volatility regularly spark discussions around great investors and the traits that qualify folks to be included in that category.
This is probably because, like most things in life, no one really questions why things are going right; everyone is after an explanation when things aren’t so great.
But rather than focus on what it is to be a great investor or how we could be the next Warren Buffett, perhaps the conversation would be more useful if it was couched in terms of how we could avoid bad investing behaviours that seem to appear when financial markets are turbulent.

Here are a few suggestions from us.
Don’t time the market
It is very common to hear the phrase “time in the market, not timing the market” bandied about but while it sounds logical, analysis backs up both parts of the phrase to explain why it makes sense, rather than take it at face value.
Timing the market is hard, and here’s why. To successfully time the market means an investor has to get not one but the following five factors right, all at the same time:
-
Identify a reliable indicator of short-term future market returns.
-
Time the exit from an asset class or the market, down to the precise day.
-
Time reentry to an asset class or the market, down to the precise day.
-
Decide on the size of the allocation and how to fund the trade.
-
Execute the trade at a cost (reflecting transaction costs, spreads, and taxes) less than the expected benefit.
To further add to the complexity of the five factors above, getting all five factors right just once is not sufficient to reap the benefits of market timing. An investor would have to do this repeatedly in order to benefit meaningfully from the exercise.
The chart below illustrates this best, showing the return of a $1,000 portfolio in various scenarios, using a traditional balanced portfolio (60% shares, 40% bonds) as the base scenario. It shows that an investor who was right 100% of the time would see a 0.2 percentage point advantage in their annualised returns over 25 years, when compared to a balanced portfolio. Getting things right 75% of the time would see an investor better off than the base scenario at the end of 25 years by $252. And being right half the time meant underperforming the balanced portfolio. Transaction costs were not taken into account in this analysis – meaning the returns would have been even lower had costs been accounted for.
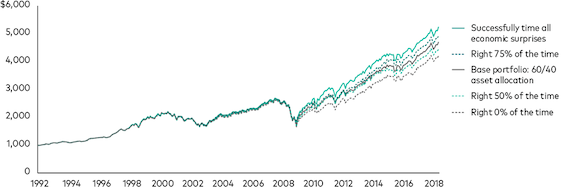
Source: Vanguard paper Here Today, Gone Tomorrow: The Impact of Economic Surprises on Asset Returns, November 2018. Vanguard calculations using data from the U.S. Bureau of Economic Analysis, the U.S. Bureau of Labor Statistics, Bloomberg, and Refinitiv.
Notes: The MSCI USA Index and the Bloomberg U.S. Aggregate Bond Index were used as proxies for U.S. stocks and U.S. bonds. The chart represents the growth of hypothetical portfolios with initial balances of $1,000 as of the start of 1992, growing through August 2018. Significant changes in nonfarm payrolls were used as economic surprises. The hypothetical investors would change the asset allocation to either 80% stocks and 20% bonds in anticipation of a positive economic surprise, or to 40% stocks and 60% bonds in anticipation of a negative surprise.
Disclaimer: Note: The example is illustrative only and is based on the factors stated. It should not be taken to contain or provide an estimate of future returns.
The other conundrum of market timing is not just knowing when to enter the market at the right time, but also exiting at the right time. It can be tempting to stay invested particularly during periods of heightened market volatility and when your portfolio balance fluctuates on a daily basis. But again, the analysis found that 80% of investors who sold equities and moved to cash during the COVID-19 induced volatility fared worse than those who held their nerve and stayed invested. In moving to cash, those investors inadvertently locked in losses permanently and deprived their portfolios of the opportunity to benefit when markets recovered shortly.
This really brings home the point that not only is precise timing nearly impossible but also that being out of the market at the wrong time costs.
Spend time in the market and contribute regularly
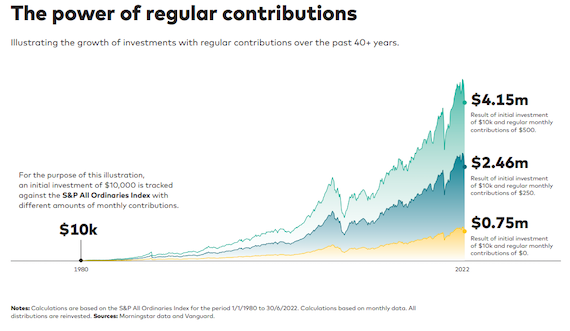
Time in the market is simply putting the theory of compounding into practice. While past performance is no guarantee of future performance, the latest Vanguard Index Chart shows that $10,000 invested in US Shares back in 1992, and left untouched over 30 years would grow to $182,376 while the same $10,000 invested in Australian Shares would result in $131,413 over the same period.
More importantly, the chart below shows that adding monthly contributions of $250 or $500 over that same 30-year period would result in a portfolio balance of almost $3 million or almost $5 million respectively.
Buying high and staying invested
Understandably, the thought of investing during a period of market volatility and potentially losing money can keep any logical person from entering the market. But Vanguard took a look at the worst possible scenarios in the last 50 years to see what happened if an investor invested at the worst possible time – at the peak of a market right before a dip. The table below lists the three worst bear markets in the last five decades and shows how far the market dipped before it started recovering, and the time it took to recover1.
|
Year |
Drawdown |
Recovery Time (years) |
10Y return from peak |
20Y return from peak |
|
1970 |
-61.9% |
8.6 |
4.2% |
10.8% |
|
1987 |
-41.3% |
4.0 |
6.4% |
10.9% |
|
2007 |
-50.9% |
5.9 |
3.0% |
3.9%** |
Note: 10Y and 20Y returns are annualised total returns.
** Noting that this is only 15 years of data, not 20 years.
Encouragingly, the results show that if an investor continued investing during the 1970 and 1987 bear markets, their portfolios would have returned an average of nearly 11% in annualised returns after 20 years. If an investor had entered the market just before the Global Financial Crisis, they would have experienced almost 4% in returns over the last 15 years, noting that those returns reflect a shorter period of time.
While we can’t all be the best investor in the world, we can certainly actively avoid being a ‘bad investor’ by learning from history and staying the course.
Contact us today on Ph 1300 136 508 to talk about your investment strategy.
1Calculated using data from Australian total return and price indices represented by spliced MSCI Australia (1970-1992)/ASX 300 (1992+). Daily data was used and reflects local currency. ‘Bear’ periods represent a period where a peak to trough drawdown of 20%+ occurs, from the starting peak to the point of recovery.
Source: Vanguard
Reproduced with permission of Vanguard Investments Australia Ltd
Vanguard Investments Australia Ltd (ABN 72 072 881 086 / AFS Licence 227263) is the product issuer. We have not taken yours and your clients’ circumstances into account when preparing this material so it may not be applicable to the particular situation you are considering. You should consider your circumstances and our Product Disclosure Statement (PDS) or Prospectus before making any investment decision. You can access our PDS or Prospectus online or by calling us. This material was prepared in good faith and we accept no liability for any errors or omissions. Past performance is not an indication of future performance.
© 2022 Vanguard Investments Australia Ltd. All rights reserved.
Important:
Any information provided by the author detailed above is separate and external to our business and our Licensee. Neither our business nor our Licensee takes any responsibility for any action or any service provided by the author. Any links have been provided with permission for information purposes only and will take you to external websites, which are not connected to our company in any way. Note: Our company does not endorse and is not responsible for the accuracy of the contents/information contained within the linked site(s) accessible from this page.